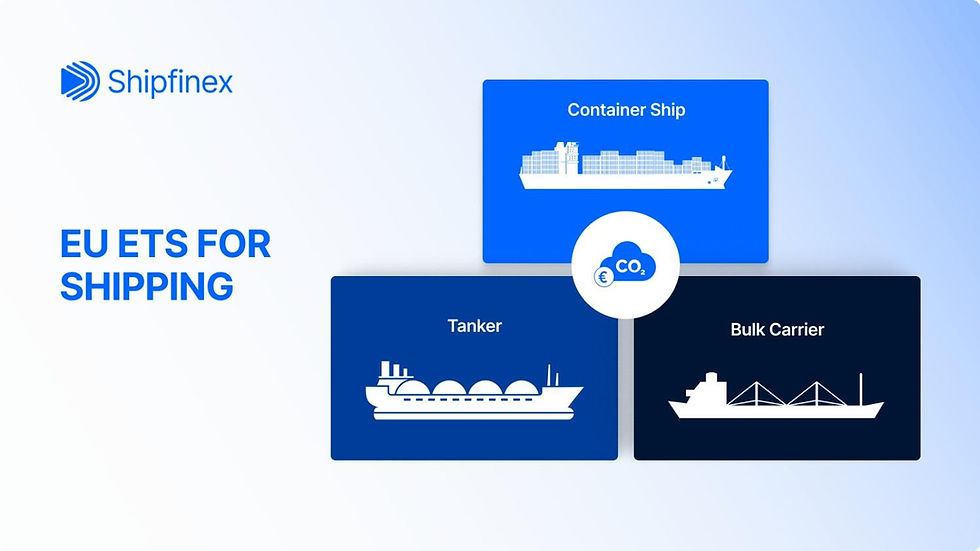
EU ETS for Shipping: Carbon Cost Modeling for Container, Bulk, and Tanker Trades
- Dushyant Bisht

- Jan 15
- 8 min read
Updated: Mar 3
Key Takeaways
EU ETS becomes fully “real” in 2026: the surrender requirement rises from 40% (2024) to 70% (2025) to 100% (2026), so carbon costs can more than double even if fuel burn stays the same.
Route exposure is the biggest cost divider: the same ship can face wildly different ETS bills depending on EU-linked voyages, because coverage is 50% EU–non-EU, 100% intra-EU, and 100% at berth.
Container ships get hit hardest: high fuel burn + frequent EU port calls can turn ETS into a multi-million-euro annual cost line, capable of wiping out a large share of distributable earnings.
Bulk carrier costs depend on cargo lanes: iron ore/Europe exposure can cost 2–3x more than grain trades with limited EU touchpoints, so “bulk” is not one category.
Tankers often absorb ETS better—but not always: costs may be a smaller share of earnings in strong markets, but in weak markets ETS can turn a “barely profitable” ship into a loss-maker.
Table of Contents
Introduction
EU ETS for Shipping: The Regulatory Framework
Carbon Allowance Pricing: The Variable Cost
Container Ships: High Fuel Consumption Meets Maximum EU Exposure
Bulk Carriers: Moderate Consumption, Variable Trade Exposure
Tankers: Lower Relative Impact, But Still Material Costs
The Carbon Cost Modeling Framework
Charter Market Pass-Through: Who Actually Pays?
Conclusion: What EU ETS Changes in 2026
FAQS About EU ETS for Shipping
Two ships. Same size. Same fuel consumption. But one faces €2.1 million in annual EU ETS carbon costs while the other pays just €680,000. The difference? Trade routes and cargo types. For ship owners and aspiring owners, understanding EU ETS cost modeling isn't academic; it's the difference between profitable operations and margin erosion that eliminates the majority of distributable earnings.
The European Union's Emissions Trading System expanded to maritime transport in January 2024, creating a new operating cost that varies dramatically by Ship type, trade pattern, and cargo carried.
This article breaks down EU ETS costs by Ship type, reveals trade-specific carbon exposure, and provides a modeling framework aspiring owners can use to assess any ship.
EU ETS for Shipping: The Regulatory Framework
EU ETS launched for shipping January 1, 2024, with phased implementation: 40% of emissions in 2024, 70% in 2025, and 100% in 2026 [1]. The regulation applies to ships over 5,000 GT on voyages to, from, or within EU ports, regardless of flag state. This means ships registered in Panama, Liberia, or Marshall Islands face full compliance if conducting European business.
Coverage operates on geographic basis: 50% of emissions for voyages between EU and non-EU ports, 100% for voyages within EU ports, and 100% at berth [1]. Ship operators must surrender carbon allowances by September each year matching their covered emissions.
Unlike a fixed tax, EU ETS operates through market-based allowance trading. European Union Allowances trade on exchanges with prices determined by supply and demand across all ETS-covered sectors [2]. This means factors unrelated to shipping, natural gas prices, electricity generation patterns, industrial production, directly influence carbon costs ship owners face.
From the Helm: Common Misconception
Many aspiring ship owners assume EU ETS is a "tax" or fixed fee that can be budgeted like port charges. It's not. EU ETS is a market-based system where allowance prices fluctuate daily. A Ship's annual carbon cost in 2024 could be 30% higher or lower than projections depending on when allowances are purchased. Always ask: "How are carbon costs managed, at what price are they modeled, and who bears price risk if markets move?"
Carbon Allowance Pricing: The Variable Cost
During 2024, EUA prices have traded in a range of approximately €65-85 per tonne of CO2 [2]. A €20 swing translates to €200,000 in annual cost variance for a Ship with 10,000 tonnes of covered emissions. For larger container ships with 50,000+ tonnes covered, that same price swing represents €1 million difference.
Historical volatility reveals even greater ranges. Over 24 months, EUA prices ranged from €50 to over €100 per tonne, representing 100% price variation [2]. Forward curves suggest €90-100 for 2025-2026 delivery. If accurate, Ships face higher carbon costs even before accounting for phase-in percentage increases. [2]
Consider the financial impact: a ship emitting 10,000 tonnes CO2 annually under EU ETS coverage pays €650,000 at €65/tonne, €850,000 at €85/tonne, or €1,000,000 at €100/tonne. This €350,000 range from price volatility alone can eliminate 3-5% of Ship earnings. [2]
Risk Disclosure: Carbon allowance prices are subject to market volatility driven by factors beyond maritime sector control. Actual costs may differ significantly from projections. This represents ongoing operational risk affecting earnings available for distribution.
Container Ships: High Fuel Consumption Meets Maximum EU Exposure

Container ships face the most severe carbon cost impact due to high fuel consumption, speed-sensitive operations, and trade patterns heavily weighted toward European ports. Modern 8,000-15,000 TEU Ships consume 150-250 tonnes of fuel daily, generating 126,000-220,000 tonnes of CO2 annually [3].
Analysis of typical deployment patterns suggests 60-80% of voyages for many ships involve EU ports. This high exposure means significant portions of total emissions fall under ETS coverage.
Real Cost Calculation:
Consider a 10,000 TEU container ship on Asia-Europe routes. Annual fuel consumption: 45,000 tonnes VLSFO. CO2 emissions: 141,795 tonnes (45,000 × 3.151 conversion factor). With 65% EU port exposure, covered emissions reach 92,167 tonnes.
Under 2024's 40% phase-in: 36,867 tonnes requiring allowances. At €80/tonne: €2,949,360 annual carbon cost. At 70% coverage in 2025: €5,161,380. At full 2026 implementation: €7,373,360 [1][2][3].
Impact on Earnings:
A Ship generating €35 million annual charter revenue with historical operating costs of €22 million shows pre-ETS net income of €13 million. Post-ETS in 2026 with €7.4 million carbon costs: net income drops to €5.6 million. Carbon costs represent 57% of previously distributable earnings.
Trade Route Variations:
Asia-Europe: €7-9 million annual (high EU exposure). Transatlantic: €5-7 million (moderate exposure). Intra-Europe: €3-4 million (full coverage but shorter distances). Asia-Middle East: €1.5-2.5 million (low EU exposure) [3].
Bulk Carriers: Moderate Consumption, Variable Trade Exposure

Bulk carriers present nuanced carbon costs highly dependent on cargo type and trade routes. Typical 60,000-180,000 DWT ships consume 35-65 tonnes/day, generating 44,000-66,000 tonnes CO2 annually [4]. However, EU exposure varies 20-60% depending on cargo flows.
Cargo-Specific Analysis:
Iron Ore (Australia/Brazil to Europe): High EU exposure (50-60%). An 82,000 DWT Panamax with 55% exposure faces 24,255 tonnes covered emissions at full implementation. At €80/tonne: €1,940,400 annually.
Grain (Americas to Asia): Low EU exposure (15-25%). Same ship with 20% exposure: 8,820 tonnes covered. At €80/tonne: €705,600 annually, less than one-third the iron ore scenario.
Coal (Asia to Europe): High exposure (55-65%) but declining trade volumes. Carbon costs €1,800,000-2,500,000 annually against uncertain market backdrop.
Fertilizer (Middle East to Europe): Moderate exposure (35-45%). Carbon costs €1,100,000-1,600,000 annually [4].
The strategic consideration: bulk carriers with flexible trade patterns can partially mitigate EU ETS costs by shifting toward non-EU routes when carbon prices spike. However, flexibility is cargo-dependent and may reduce freight rate opportunities.
Tankers: Lower Relative Impact, But Still Material Costs
Tankers generally face lower carbon costs relative to revenue compared to container ships, but absolute costs remain substantial. Product and crude tankers consuming 30-80 tonnes/day generate 25,000-66,000 tonnes CO2 annually [5].
Aframax Crude Tanker (115,000 DWT):
Annual fuel: 12,500 tonnes. CO2 emissions: 39,388 tonnes. With 40% EU exposure: 15,755 tonnes covered. At €80/tonne and full 2026 implementation: €1,260,400 annually.
MR Product Tanker (50,000 DWT):
Annual fuel: 8,000 tonnes. CO2 emissions: 25,208 tonnes. With 50% EU exposure (refined products to European markets): 12,604 tonnes covered. At €80/tonne: €1,008,320 annually [1][2][5].
Impact on Earnings:
Unlike container ships where carbon costs can exceed 50% of net income, tankers typically see carbon costs representing 15-25% of distributable earnings due to higher freight margins. However, during weak markets, this percentage spikes to 40-50%, turning marginally profitable voyages into losses.
Product tankers often face higher EU exposure than crude tankers because refined products flow intensively to European consumption markets. Crude tankers show more variable exposure based on loading/discharge regions.
The Carbon Cost Modeling Framework

For aspiring owners, the ability to independently verify carbon cost projections separates informed decisions from blind reliance on offering assumptions.
Step 1: Determine Annual Fuel Consumption
Review ship specifications or historical consumption data. Account for both main engine and auxiliary consumption.
Step 2: Convert Fuel to CO2 Emissions
Apply standardized factors: Heavy Fuel Oil (3.114), VLSFO (3.151), MGO/MDO (3.206), LNG (2.750 plus methane considerations) [1].
Step 3: Assess EU Port Exposure
Analyze trade pattern to determine percentage of voyages involving EU ports. Apply 50% factor for EU-to-third-country voyages, 100% for intra-EU.
Step 4: Apply Phase-In Percentages
2024: 40%. 2025: 70%. 2026: 100%.
Step 5: Calculate Allowance Costs
Multiply covered emissions by EUA price. Use scenarios: conservative (€95), base (€80), optimistic (€70).
Step 6: Assess Impact on Earnings
Deduct carbon costs from historical net income. Calculate percentage reduction in distributable earnings.
Example: 76,000 DWT Panamax Bulk Carrier
Fuel: 13,000 tonnes VLSFO
CO2: 40,963 tonnes (13,000 × 3.151)
EU exposure: 35%
Covered: 14,337 tonnes (40,963 × 0.35)
2026: 14,337 tonnes × 100%
At €85/tonne: €1,218,645
Impact: If Ship distributed €4.5M historically, carbon costs reduce by 27%
Charter Market Pass-Through: Who Actually Pays?
Theory suggests ship owners pass carbon costs to charterers through higher rates. Reality: pass-through success depends on market conditions.
In tight markets (high demand, limited supply), owners successfully pass through 80-100% of carbon costs. In weak markets, owners absorb 40-60% through margin compression [6].
For aspiring owners, carbon costs represent both direct OPEX increases if absorbed and charter rate assumption risk if pass-through fails.
Conclusion
EU ETS introduces ship-type-specific carbon costs ranging from €500,000 to €11+ million annually depending on ship category, fuel consumption, and trade patterns. Container ships face maximum exposure, bulk carriers show cargo-dependent variations, and tankers generally see lower relative impact but still material costs.
Understanding EU ETS costs requires ship-specific analysis beyond headline numbers. Ship owners and aspiring owners deserve comprehensive information about carbon costs, not simplified narratives ignoring industry fundamentals.
Disclaimer:
This material is provided for informational purposes only and does not constitute financial, investment, or legal advice. All digital assets carry inherent risks, including potential loss of capital. Past performance is not indicative of future results. Please review the relevant offer and risk disclosures carefully before making any financial decision.
FAQS About EU ETS for Shipping
How much does EU ETS cost for container ships?
Container ships face the highest EU ETS costs, typically €4.5-11 million annually depending on size and trade routes. A 10,000 TEU Ship on Asia-Europe routes could face €11.4 million in annual carbon costs at full implementation in 2026 (assuming €80/tonne carbon prices).
Which ship type has the lowest EU ETS carbon costs?
Tankers and bulk carriers with predominantly non-EU trade routes generally face lower carbon costs, ranging from €500,000 to €2.5 million annually. However, costs vary significantly based on specific trade patterns rather than Ship type alone.
How do I calculate EU ETS costs for a specific ship?
Calculate annual fuel consumption, convert to CO2 emissions (multiply by 3.151 for VLSFO), assess EU port exposure percentage, apply phase-in percentages (40% in 2024, 70% in 2025, 100% in 2026), and multiply covered emissions by carbon allowance prices (currently €65-85/tonne).
Do carbon costs reduce ship owner earnings?
Yes, EU ETS costs are operating expenses deducted before earnings distribution to owners. For container ships, carbon costs can represent 50-85% of previously distributable earnings. For bulk carriers and tankers, the impact ranges from 15-40% depending on trade exposure.
Can ship owners pass EU ETS costs to charterers?
Pass-through ability depends on market conditions. In strong shipping markets, owners can pass through 80-100% of carbon costs via higher charter rates. In weak markets, owners may absorb 40-60% of costs through margin compression.


Dushyant Bisht
Expert in Maritime Industry
Dushyant Bisht is a seasoned expert in the maritime industry, marketing and business with over a decade of hands-on experience. With a deep understanding of maritime operations and marketing strategies, Dushyant has a proven track record of navigating complex business landscapes and driving growth in the maritime sector.
Email: [email protected]
References
[1] European Energy Exchange. (2024). European Emission Allowances market data. Retrieved from https://www.eex.com/en/market-data/environmental-markets/eua-primary-auction-spot-download
[2] Clarksons Research. (2024). Container ship fleet statistics and operational data. Retrieved from https://www.clarksons.com/services/research/
[3] Baltic Exchange. (2024). Dry bulk shipping indices and operational analysis. Retrieved from https://www.balticexchange.com/en/data-services/market-information0.html
[4] BIMCO. (2024). EU ETS charter party clauses and guidance. Retrieved from https://www.bimco.org/contracts-and-clauses/bimco-clauses/current/eu-ets