Ship Operating Costs in 2026: Complete Cost Breakdown
- Vikas Pandey

- Sep 24, 2025
- 13 min read
Key Takeaway
Ship operating costs are driven mainly by fuel, port charges, crew, insurance, and maintenance, and they run 24/7, even when the vessel is idle.
The real metric that matters is net income after OPEX, not just charter revenue.
In 2026, EU ETS and IMO CII make emissions performance a direct cost and routing factor.
Ships with strong maintenance history, stable crewing, and efficient voyages typically deliver more predictable returns.
Cost transparency is becoming an advantage, better reporting improves pricing, risk control, and investor trust.
Table of Contents
The Five Major Cost Categories
Fixed vs. Variable Expenses
Fuel Costs: The Biggest Expense
Crew and Manning Expenses
Insurance and Safety Costs
Maintenance and Repairs
Port Charges and Canal Fees
How Operating Costs Affect Investment Returns
Cost Optimization Strategies
The Future of Maritime Cost Transparency
2026 Cost Drivers
Conclusion
FAQs

Ever wondered what it actually costs to keep a massive ship sailing across the world's oceans? Here's a reality check: average daily operating costs across different ship types reached $7,474 in 2022, according to Drewry. [1]
Subsequent annual reviews for 2023-2025 show continued upward pressure from crew, insurance, and repair costs, meaning owners in 2026 must budget for higher OPEX than pre-2022 levels. All cost figures in this guide are indicative ranges based on typical mid-sized commercial vessels; actual numbers vary by ship type, age, and trading area.
The maritime industry moves $14 trillion worth of goods annually, yet most people are unaware of the complex cost structure that keeps this global engine running. This lack of transparency has traditionally made ship ownership exclusive to a select few with substantial financial resources. But times are changing.
Quick Answer: What are ship operating costs (OPEX)?
Ship operating costs are the day-to-day expenses required to keep a vessel in safe, trading condition, whether it is earning freight or idle.
They usually include:
Crew wages and benefits
Insurance (H&M and P&I)
Technical management fees
Maintenance, spares, and repairs
Stores, lubricants, and provisions
OPEX is different from voyage costs (VOYEX) such as fuel, port charges, and canal fees, which rise and fall with each trip.
In this comprehensive guide, we'll break down every major cost category associated with running a ship, explain how these expenses impact ownership decisions, and reveal why cost transparency is revolutionizing maritime finance through fractional ownership opportunities.

The Five Major Cost Categories
Ship operating costs fall into five primary categories that determine the profitability of any maritime operation. These include crew wages and travel, management fees, hull and machinery, and P&I insurance premiums, as well as stores, lubricants, spare parts, maintenance and repairs, survey and certification, and drydocking.
Think of these costs like running a floating city that never stops moving. Unlike a factory that can shut down for maintenance, ships generate expenses 24/7, whether they're carrying cargo or sitting empty at port.
Understanding the Scale
A standard Panamax containership has operational costs of about $9 million per year. That's roughly $25,000 every single day, rain or shine. For ship owners, this represents a significant cash flow commitment. For owners of tokenized maritime assets, these are the expenses that are deducted before returns are credited to your account.
Key Takeaway: Unlike traditional investments, where you buy and forget, maritime assets have ongoing operational realities that directly impact your returns. Understanding these costs helps you evaluate whether a particular ship represents a sound investment opportunity.
If you are new to these concepts, read our beginner-friendly overview: Understanding Cost of Operating a Ship. For a deeper look at how OPEX compares with long-term CAPEX, see: OPEX vs CAPEX on Ships: What Costs Exist and Why They Spike. To explore how macro trends like interest rates and trade cycles influence these costs, see: Economic Factors Affecting Shipping Industry Costs in 2026.
Fixed vs. Variable Expenses: The Two-Part Cost Structure

Maritime operating costs are split into two distinct categories, each affecting cash flow differently:
Fixed Costs (Occur Regardless of Activity)
Crew wages and benefits
Insurance premiums
Management fees
Regulatory compliance costs
Basic maintenance
These expenses continue whether the ship carries cargo or sits idle. They're the "baseline" costs of ownership that never disappear.
Variable Costs (Change with Activity Level)
Fuel consumption
Port charges
Canal fees
Cargo handling
Voyage-specific maintenance
In this guide, when we say 'OPEX' we mean the fixed technical costs: crew, insurance, management, and technical upkeep. Fuel, port charges, and canal tolls are treated as variable voyage expenses (VOYEX).
On many deep-sea trades, fuel and port charges can together account for roughly half of total voyage-related expenses, with fuel alone often representing 40-50% depending on bunker prices and speed, based on industry benchmarks from Drewry manning and OPEX studies. [1] This means active, well-utilized ships tend to be more profitable per dollar of operating expense.
Why This Matters for Investors: Ships with higher utilization rates (more time carrying cargo) spread their fixed costs across more revenue-generating activities, potentially delivering better returns to token holders.
Fuel Costs: The Biggest Single Expense
Fuel accounts for the majority of maritime operating expenses, and for good reason. Large commercial vessels can burn through 200-300 tons of fuel daily during active voyage periods. At current bunker fuel prices, ranging from $400 to $600 per ton, daily fuel costs alone can exceed $150,000 for larger vessels.
Why Fuel Costs Fluctuate Dramatically
Unlike your car's gas tank, ship fuel costs are affected by:
Global oil price volatility
Environmental regulations (cleaner fuels cost more)
Route efficiency and weather conditions
Vessel age and engine efficiency
Speed optimization strategies
The Green Transition Impact
New environmental regulations are reshaping fuel costs across the industry. The International Maritime Organization's sulfur emission limits have increased fuel expenses by 15-20% for many operators. Ships built with more efficient engines or alternative fuel capabilities often justify higher initial costs through lower operational expenses.
Insider's View: Many experienced ship operators now budget fuel costs at 50% above historical averages to account for regulatory changes and market volatility. This conservative approach helps maintain consistent returns even during price spikes.
Crew and Manning Expenses: The Human Element
These costs include wages, training, health insurance, pensions, onboard accommodations, and welfare services to maintain crew well-being and performance. Modern ships typically operate with crews of 15 to 25 people, depending on the ship type and trade routes.
Crew Cost Breakdown
Basic wages: $8,000-15,000 monthly per crew member
Benefits and insurance: An additional 30-40% of wages
Training and certification: $50,000-100,000 annually per vessel
Crew change logistics: $200,000-400,000 annually
Onboard provisions and welfare: $100-150 per person daily
The Skilled Labor Challenge
The maritime industry faces a growing shortage of qualified officers and engineers. This talent scarcity drives up crew costs but also increases the value of vessels with experienced, stable manning arrangements.
Key Takeaway: Ships with lower crew turnover and established manning partnerships often deliver more predictable operational costs, translating to steadier returns for owners.
Insurance and Safety Costs: Protecting the Investment
Maritime insurance represents one of the most complex and essential cost categories. Marine insurance cover rose 8% on average in recent years due to increased global risks and higher claim values.
Essential Insurance Types
Hull and Machinery (H&M): Covers physical damage to the vessel
Protection and Indemnity (P&I): Covers third-party liabilities
Cargo insurance: Protects goods during transport
War risks: Covers conflict-related damages
Cyber liability: Growing concern for modern vessels
Annual Insurance Costs
Expect insurance premiums to range from $500,000 to $2 million annually for a typical ship, depending on vessel age and condition, trade routes and risk exposure, claims history and safety record, and current market conditions.
Safety Compliance Costs
Beyond insurance, ships must maintain certifications and safety equipment:
Annual surveys and inspections: $75,000-150,000
Safety equipment updates: $200,000-500,000 every few years
Environmental compliance systems: $1-3 million for retrofits
Why This Matters: Ships with excellent safety records and modern compliance systems often secure better insurance rates, directly improving investment returns.
Maintenance and Repairs: Keeping Steel Floating
Ships operate in one of the world's most corrosive environments, saltwater. Maintenance isn't optional; it's survival. Ships returned to yards this year, pushing up costs as deferred pandemic maintenance created a backlog.
Planned Maintenance Categories
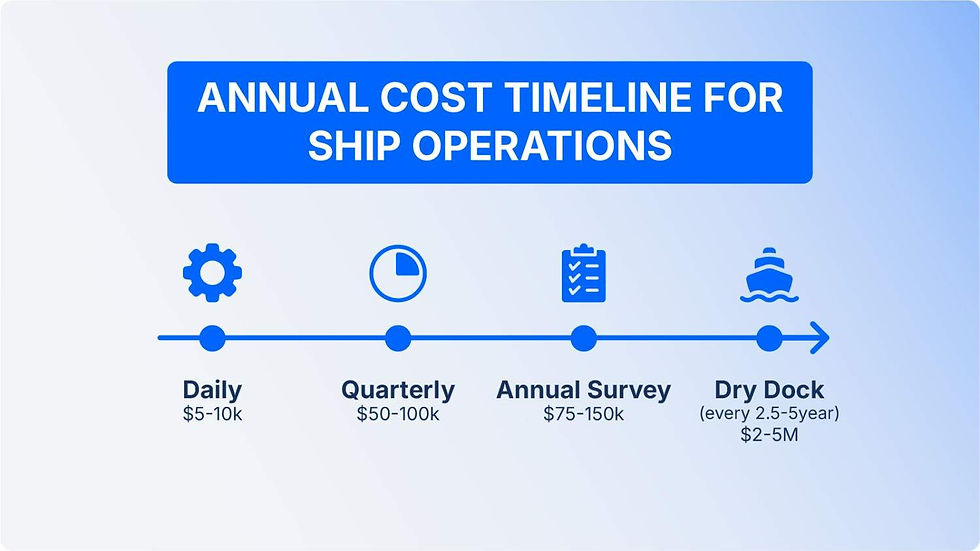
Daily upkeep: $5,000-10,000 per day
Dry dock inspections: Required every 2.5-5 years, costing $2-5 million
Engine overhauls: $500,000-2 million every 5-10 years
Hull coating and steel work: $1-3 million during dry dock
Equipment upgrades: $500,000-$2 million annually
Unplanned Repairs: The Wild Card
Mechanical failures at sea can cost anywhere from $50,000 for minor issues to several million dollars for major engine problems that require emergency port calls and specialized technicians.
The Age Factor
Older vessels (15 years or more) typically experience an annual increase in maintenance costs of 5-8%, while newer ones may have lower maintenance costs.
Insider's View: Experienced operators maintain detailed maintenance histories and predictive maintenance programs. This data transparency helps to understand long-term cost trends and vessel reliability, crucial information that is often hidden in traditional maritime investments.
Port Charges and Canal Fees: The Toll Roads of the Sea

Every port visit generates fees, and these costs vary dramatically based on location, size, and cargo type. Port charges represent a significant share of operating costs for many ship types, based on industry benchmarks.
Typical Port Cost Components
Port dues: Based on ship size and duration of stay
Pilotage fees: Mandatory local navigation assistance
Tugboat services: Required for larger ships
Stevedoring: Loading and unloading cargo
Agency fees: Local representation and customs clearance
Canal Transit Costs
Major shipping routes include expensive canal transits:
Suez Canal: $300,000-700,000 per transit
Panama Canal: $200,000-500,000 per transit
Various straits and channels: $10,000-100,000 each
Port Efficiency Impact
Efficient ports reduce costs through faster turnaround times, whereas congested ports incur additional expenses due to waiting time, overtime charges, and schedule disruptions.
Key Takeaway: Ships operating on well-established trade routes with efficient port networks tend to have more predictable port costs, benefiting both operational planning and investor returns.
How Operating Costs Affect Investment Returns
Understanding operational expenses is crucial for anyone considering ship ownership. Here's how these costs directly impact your potential returns:
The Revenue-to-Return Formula
Gross Charter Revenue minus Operating Expenses minus Reserves and Management Fees equals Net Income Available for Distribution.
For example, if a ship generates $20,000 per day in gross charter revenue and has $12,000 per day in OPEX plus an average of $2,000 per day in management fees and reserves, that leaves $6,000 per day in net income before financing. If fuel and voyage costs spike or a drydock takes the ship off-hire, that net figure can drop quickly, which is why understanding both OPEX and VOYEX is essential when evaluating expected returns.
Typical Cost Allocation for Investors
Operating expenses: 60-70% of gross revenue
Management and reserves: 5-10% of gross revenue
Available for distribution: 20-35% of gross revenue
Why Cost Transparency Matters
Traditional maritime investments often lack detailed operational cost disclosure. Tokenized ships through platforms like Shipfinex provide unprecedented transparency, allowing investors to monitor real-time expenses, understand seasonal cost variations, evaluate management efficiency, and make informed decisions about holding periods.
Risk vs. Return Considerations
Higher operational efficiency doesn't always mean higher returns. Sometimes, ships with slightly higher costs deliver superior returns through premium route access, better customer relationships, higher utilization rates, and superior safety records.
Key Takeaway: Smart owners prioritize net returns and operational efficiency, rather than just focusing on low costs. A well-managed ship with transparent cost reporting often outperforms "cheaper" alternatives with hidden expenses.
Cost Optimization Strategies: Maximizing Efficiency
The three main components in operating costs are cost optimization, cost estimation, and cost control. Modern ship operators employ various strategies to manage expenses without compromising safety or service quality.
Fuel Optimization Techniques
Weather routing: Using advanced meteorology to find efficient routes
Speed optimization: Balancing fuel consumption with schedule requirements
Engine tuning: Regular maintenance to maintain fuel efficiency
Alternative fuels: Investigating cleaner, cost-effective options
Crew Cost Management
Stable manning partnerships: Reducing recruitment and training costs
Cross-training programs: Improving crew flexibility and efficiency
Remote monitoring: Reducing the need for specialized technicians
Predictive maintenance: Minimizing emergency repairs
Technology Integration
Digital maintenance systems: Tracking costs and predicting needs
Fuel monitoring systems: Real-time consumption optimization
Route optimization software: Minimizing port fees and transit costs
Automated reporting: Reducing administrative overhead
Insurance and Risk Management
Safety performance programs: Qualifying for premium discounts
Risk pooling arrangements: Sharing certain costs across fleets
Comprehensive maintenance: Preventing costly claims
Modern safety equipment: Meeting latest standards efficiently
Insider's View: The most successful operators view cost optimization as an ongoing process, not a one-time project. They invest in systems and people that deliver long-term efficiency improvements, creating sustainable competitive advantages that benefit all stakeholders.
The Future of Maritime Cost Transparency

The maritime industry is undergoing a transparency revolution that benefits all stakeholders. Traditional opacity around operational costs is giving way to detailed, real-time reporting that enables better decision-making.
Technology-driven transparency includes blockchain recording for immutable cost tracking and reporting, IoT sensors for real-time monitoring of fuel consumption and equipment performance, digital platforms that provide accessible dashboards for all stakeholders, and automated reporting that reduces errors and improves timeliness.
The regulatory push for disclosure encompasses environmental reporting with new requirements for emissions and fuel data, financial transparency through enhanced disclosure requirements, safety reporting that includes detailed maintenance and incident tracking, and performance metrics using standardized efficiency measurements.
For ship owners, the benefits include access to capital as transparent operations attract more owners, better valuations since clear cost structures support higher asset values, operational improvements through data-driven insights that optimize performance, and risk management via early warning systems that prevent costly problems.
For aspiring owners, the advantages encompass informed decisions through complete cost visibility, performance monitoring that allows real-time tracking of operational efficiency, fair pricing through transparent costs that support accurate valuations, and identification of operational risks before ownership.
The shift toward cost transparency is creating opportunities for both ship owners seeking liquidity and aspiring owners looking to access maritime assets. Platforms that provide detailed operational reporting are leading this transformation and setting new industry standards for accountability.
2026 Cost Drivers: What's Changing This Year (EU ETS and IMO CII)
In 2026, two major forces are reshaping ship operating decisions and overall voyage economics: EU ETS and IMO CII. For EU ETS, shipping entered the scheme in 2024 at 40% of emissions covered, rising to 70% in 2025 and reaching 100% of applicable voyage emissions in 2026. [2][3] That means ships calling at EU ports now face a full carbon allowance cost on their reported CO2 emissions, with EU Allowance prices trading in a range that can add hundreds of thousands of euros to annual operating costs for active traders. [4]
From 2026, the scope also expands to include methane and nitrous oxide, increasing the emissions baseline behind each compliance calculation. [5] Carbon pricing is now a core factor in route choice, chartering terms, and speed policy, not just a compliance topic. Operators are responding by improving fuel efficiency, adjusting speed, adding contract clauses to share carbon costs, and improving emissions tracking.
Second, the IMO Carbon Intensity Indicator (CII) remains in force, pushing ships to improve annual efficiency ratings. CII can influence speed policies (slow steaming), voyage planning, hull and propeller maintenance, and retrofit timing. At the same time, IMO's 2026 update cycle tightened multiple conventions simultaneously. Amendments to SOLAS, MARPOL, and STCW entered into force on 1 January 2026, covering mandatory container loss reporting, updated crew welfare and training requirements, fire safety standards, and cargo handling procedures. [6][7]
These changes increase inspection, training, safety equipment, and compliance costs, particularly for older ships that require operational adjustments to maintain compliant status. Together, ETS and CII make emissions performance a direct cost factor in 2026.
Conclusion: Ship Operating Costs
Operating a commercial ship incurs millions of dollars in annual expenses, which include fuel, crew, insurance, and maintenance. Average daily operating costs reflect the complex realities of maintaining massive vessels in operation in challenging environments.
For ship owners, these operational costs represent both a challenge and an opportunity.
While expenses are substantial, the growing availability of fractional ownership through tokenization provides new ways to access capital while maintaining operational control.
For aspiring owners, understanding operational costs isn't just academic; it's essential for evaluating potential returns and making informed decisions about maritime assets. The transparency revolution in shipping is making this information more accessible than ever before.
The maritime industry's future lies in operational transparency, technological optimization, and innovative financing structures that benefit all stakeholders. Whether you're a shipowner exploring tokenization or an investor considering maritime assets, understanding the true cost of running ships provides the foundation for informed decision-making in this evolving market.
As the industry continues modernizing, those who embrace cost transparency and operational efficiency will be best positioned to capitalize on the opportunities ahead.
FAQS for Ship Operating Costs in 2026
What are ship operating costs (OPEX)?
Ship operating costs (OPEX) are the ongoing costs to keep a vessel running day to day, like crew wages, insurance, routine maintenance, spares, and management fees. They are different from voyage costs (VOYEX) such as fuel, port charges, and canal fees, which rise and fall with each trip.
What is the average daily operating cost of a ship in 2026?
There isn't one single number because costs vary by ship type and size, but an industry benchmark often cited is Drewry's estimate of $7,474 average daily vessel operating costs in 2022. [1] Recent 2025-26 industry reviews show this benchmark has moved higher as manning, insurance, and repair costs continue to rise, so investors should treat $7,474 as a lower historical reference point rather than a current ceiling. Adjust for crew, insurance, and maintenance changes specific to the vessel type and trade route being evaluated.
What is included in OPEX vs VOYEX?
OPEX usually includes crew, insurance, technical management, stores and spares, and routine maintenance. VOYEX includes fuel, port dues, pilotage, tug fees, canal tolls, cargo handling, and other trip-specific charges. Separating OPEX and VOYEX helps you compare ships fairly and estimate profit under different routes.
What is P&I insurance, and why does it matter?
P&I (Protection and Indemnity) insurance covers third-party liabilities, like pollution, injury, wreck removal, and cargo claims. It matters because one incident can create huge legal and cleanup costs. A strong safety record, good maintenance history, and compliance systems can help reduce total insurance cost over time.
How often do ships need drydocking, and what does it cost?
Most ships must drydock on a cycle (often every few years) for hull inspections, coatings, steelwork, and major maintenance. Drydock is expensive because the ship stops earning revenue while costs spike for yard work and parts. Investors should always check drydock timing, past yard invoices, and what upgrades are planned.
How do regulations change operating costs in 2026?
Two big cost pressures are compliance and reporting. The EU ETS for maritime reached 100% of emissions requiring allowances in 2026 for covered voyages, which adds a real carbon cost layer. [2][3] Also, IMO requires ships to calculate and report CII annually, influencing speed, routing, and retrofit decisions.
Why are port charges and canal fees so expensive?
Ports charge for services like berth dues, pilots, tugboats, agency support, and cargo handling. Canal fees reflect the value of time saved on global routes and can be very high on major passages. Congestion can raise costs further through waiting time, overtime, and schedule disruption, so port efficiency matters almost as much as port price.
How does the EU ETS change ship operating costs in 2026?
From 2026, ships calling at EU ports must account for 100% of their applicable CO2 emissions under the EU Emissions Trading System, up from 40% in 2024 and 70% in 2025. [2][3] Owners or charterers must buy and surrender carbon allowances, adding a real cost layer on top of fuel. EU Allowance prices have traded between approximately €60 and €100 per tonne in recent years, and from 2026 the scope also expands to include methane and nitrous oxide, increasing the compliance burden further. [4][5] This can materially change route economics, speed policies, and even which ships are selected for EU trades, making emissions performance a direct financial consideration for any owner or aspiring owner evaluating maritime assets.
Disclaimer: This material is provided for informational purposes only and does not constitute financial, investment, or legal advice. All digital assets carry inherent risks, including potential loss of capital. Past performance is not indicative of future results. Please review the relevant offer and risk disclosures carefully before making any financial decision.

Capt. Vikas Pandey
Founder & CEO of Shipfinex
Vikas Pandey is the Founder & CEO of ShipFinex, where he is building a digital exchange to make maritime asset investment more accessible through tokenization, DeFi, and web3 technologies. A maritime expert and entrepreneur with over two decades of experience, he has led ventures across shipping, fintech, blockchain, healthcare, and education.