Freight Market vs Vessel Value: 2026 Market Guide

Updated: 3 days ago
Key takeaways
Freight rates usually lead ship values. When earnings rise, buyers pay more for ships. The Drewry composite container index peaked at $10,377 per 40ft in September 2021, against $1,402 in 2019. Clarksons’ containership price index rose 168% over 2021.
The lag between rates and prices varies by cycle. In March 2021, prices for 10-year-old container ships more than doubled in under six months, where similar gains took nearly 18 months in earlier cycles.
Both markets can fall as sharply as they rise. The Baltic Dry Index dropped about 60%, from 976 to 393, between 2 January and 14 May 2020. It stood at 2,854 on 9 November 2026.
War-risk insurance scales with ship value. It is quoted as a percentage of hull value per transit. A 0.3% premium on a $225 million hull adds about $675,000 per transit. Reported Hormuz quotes reached 3% to 10% in July 2026.
Disruption moves both markets within weeks. The Red Sea attacks and the 2026 Hormuz conflict changed routing, insurance costs and rates. About 60% of Asia to Europe container capacity was back on the Suez route by early November 2026, and Shanghai to Rotterdam spot was $3,615 per 40ft.
Appraisers use three valuation methods. These are market-based (last done), income and cost approaches, and they are often combined.
Table of Contents
The global maritime transport system rests on two linked markets: the freight market and the vessel value market. One sets the price of moving goods. The other sets the worth of the ships that move them.
Ship values cover a wide range. A 10-year-old 6,600 TEU container ship was valued at about $50 million in April 2021, and a 24,000 TEU ship carries a hull value of roughly $225 million in a September 2026 industry analysis. Those prices follow the rates ships can earn, and rates change fast. On 9 November 2026 the Baltic Dry Index stood at 2,854 points, its highest since 9 October.
This guide explains how the two markets connect. It covers the fundamentals of the freight market, the drivers of vessel valuation, and how each market affects the other, using data from 2020 to November 2026. Understanding the link helps readers interpret maritime shipping rates, see how ships are priced, and follow how global trade absorbs disruption such as the Red Sea attacks and the 2026 Hormuz conflict.
The freight market: fundamentals and dynamics

The freight market, also known as the ocean freight market, is where the price for transporting cargo by sea is determined. It is a vast and dynamic ecosystem with key players including:
Shippers: companies with cargo to move, such as a car manufacturer or a grain trader.
Carriers: The shipowners or operators who transport the cargo.
Freight Forwarders & Brokers: the intermediaries who connect shippers with carriers and handle the logistics.
Many factors move shipping rates, and they are often unpredictable. At its core the market runs on supply and demand. Rates rise when there is more cargo than ships, and they fall when there are too many vessels.
Global demand: Economic growth lifts industrial production and consumer spending, which raises demand for commodities and goods and pushes rates up.
Fuel prices: Bunker fuel is a ship's largest operating cost, so oil price changes feed into freight rates quickly.
Geopolitical disruptions: Wars, sanctions and incidents can close trade lanes, force longer routes and cut the effective supply of ships. The Ever Given grounding blocked the Suez Canal from 23 to 29 March 2021, and more than 350 ships were waiting at the peak [3].
Regulatory events: New emissions standards or safety rules can raise operating costs or push older vessels out of service, which changes supply and rates.
The market is split by cargo type: dry bulk (iron ore, coal, grain), tankers (crude oil, petroleum products, chemicals) and container ships (manufactured goods). Freight indices give a daily reading of each segment and act as benchmarks. The Baltic Dry Index (BDI), published by the Baltic Exchange, closed at 2,854 on 9 November 2026, its highest since 9 October. It had gained 3.4% in the week to 2,805 on 6 November.
Choosing between spot and contract rates, meaning short-term versus long-term agreements, is a core risk management decision for carriers and shippers.
Vessel value: what drives ship prices

Vessel value is set in the Sale & Purchase (S&P) market. Unlike a listed stock, a ship has no single observable price. Value is a complex assessment shaped by many factors, and it moves over time.
Age, condition and technical specification drive most of it. Value falls with age, and most vessels have a useful life of around 25 to 30 years. Depreciation varies: a well-maintained ship with recent technical upgrades holds its value far better than a neglected one.
The S&P market, where vessels are bought and sold, is highly cyclical. External factors shape it:
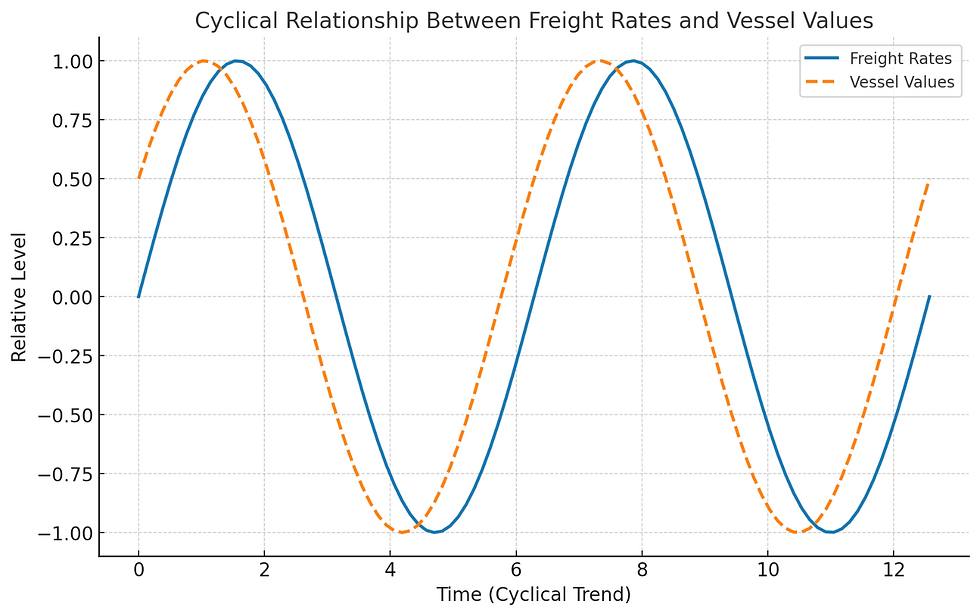
Freight rate cycles: When rates are high, a ship's earning potential is high and its S&P price tends to rise. When rates are low, prices tend to fall.
Macroeconomics: Economic conditions, interest rates and access to financing affect an owner's ability and willingness to buy or sell.
Shipyard activity: The cost and availability of newbuilding capacity affect the price of new and secondhand vessels. A large orderbook can lead to oversupply and put downward pressure on prices.
A ship's price reflects its own characteristics (age, tonnage) and the outside forces that shape its earnings. A modern, fuel-efficient vessel with high cargo capacity (DWT or TEU) commands a premium over an older, less efficient ship. For a deeper look at how appraisers work, see our vessel valuation guide.
How the freight market affects vessel values
The link between freight rates and vessel values is the central dynamic of the shipping industry. The two move in cycles, and freight rates usually lead.
When spot rates are high and forward rates point to sustained strength, ships earn more, and buyers pay more for them. S&P prices rise for most vessels, particularly those with high earning capacity.
The 2021 container market shows the pattern. Drewry's composite World Container Index peaked at $10,377 per 40ft container in September 2021, against $1,402 in 2019. Shanghai to Rotterdam reached $14,558 on 30 September 2021. Secondhand prices followed. The Clarksons containership price index rose 168% in 2021 and its overall index rose 97% . A 10-year-old 6,600 TEU ship went from $29 million in mid-2020 to $50 million by April 2021. Buyers paid up even for older ships, because spot and charter earnings were so high.
The lag between rates and prices changes from cycle to cycle. In March 2021 Clarkson Research said prices for 10-year-old container ships had more than doubled in under six months, where similar gains took nearly 18 months in 2004 to 2005 and 2016 to 2017.
Low rates work the other way. The BDI began 2020 at 976 on 2 January and fell to 393 on 14 May, a drop of about 60%. At those levels bulkers earned little, and weak earnings weighed on their values. The index then recovered to 5,650 by 7 October 2021. As the 2021 container figures show, ship prices can move by large amounts within a year when earnings change.
Methodologies: how vessel value is calculated

Given the size of S&P transactions, ship valuation methods matter to both buyers and sellers. Valuing a ship blends data, market knowledge and an expert's judgment.
Professional appraisers mainly use three methods:
Market-based (last done) method: The most common approach. It benchmarks a vessel against comparable recent sales of the same type, size, age and specification to arrive at a fair market price.
Income approach: This method looks at a vessel's future earning potential. The appraiser estimates the ship's net income over its remaining life and discounts those cash flows to a present value. It is highly sensitive to forecasts of freight rates, which can be volatile.
Cost approach: This method values the ship at its cost of replacement or reproduction. It estimates what it would cost to build an identical new vessel (reproduction cost) or one of equivalent utility and design (replacement cost), then deducts depreciation for age and condition.
These methods are often combined. Platforms such as VesselsValue and Clarksons supply large datasets, and the final assessment still needs an experienced maritime professional. Our ship finance guide explains how lenders use these valuations.
Best practices in benchmarking freight and vessel value
For shipowners and analysts, working in these markets takes rigorous analysis. Prices need to be benchmarked against relevant data.
Start with KPIs that describe a vessel's performance and market standing. For the freight market, these include revenue per ton-mile and vessel utilization rates. For the S&P market, they include market value compared with earnings, operating costs (OPEX) and age-related value trends. The aim is a consistent comparison of a vessel's price with its earnings and costs.
Benchmarking needs a relevant sample and comparable metrics. A dry bulker should be compared only with dry bulkers of similar size, age and specification, and its freight rates with the right segment benchmarks. Real-time analytics platforms now give quick access to data that was once hard to obtain, which reduces guesswork in chartering and asset valuation.
How economic and market disruptions reshape both markets
Both markets react quickly to global disruption, and a shock in one reaches the other fast. The years 2020 to 2026 show this clearly.
COVID-19. The pandemic first cut global trade, collapsed freight rates and dented vessel values (the BDI hit 393 in May 2020. Supply chain congestion and a surge in e-commerce demand then pushed container freight rates to records and container ship prices to highs.
Red Sea. Attacks on shipping from late 2023 pushed carriers to reroute around the Cape of Good Hope. Longer voyages raised ton-mile demand and supported rates in some segments, and they also raised fuel use and insurance costs. War-risk insurance is quoted as a percentage of hull value per transit, so the cost grows with the value of the ship. On a $225 million hull, a 0.3% premium adds about $675,000 per transit. Quotes vary widely by source and date: 0.5% to 2% in May 2026, and 0.2% to 0.5% for most ships in an October 2026 analysis. By early November 2026 about 60% of Asia to Europe container capacity was sailing through Suez, and the Shanghai to Rotterdam spot rate was $3,615 per 40ft container in the week to 5 November.
Strait of Hormuz. A conflict involving Iran that began in late February 2026 added a second source of risk. Marsh's Marcus Baker said in July 2026 that war-risk rates for Hormuz could run from 3% to 10% of hull value, against about 0.25% before the war.
This volatility makes asset valuation harder and puts a premium on vessels that are fuel-efficient or have flexible propulsion systems. The freight and vessel value trends respond to pandemics, trade disputes and conflicts within weeks, which makes them useful readings of the global economy's health.
Regional focus: freight market and vessel value in Asia, Europe and the Americas
Freight and vessel values differ across regions because supply, demand and market activity differ.
Asia
Asia is a primary hub for freight activity because of its manufacturing and trade volumes. The Shanghai Containerized Freight Index (SCFI) is a key benchmark for rates out of Shanghai, including the transpacific and Asia to Europe lanes. It stood at 3,633.45 on 6 November 2026, down 53.9 points on the week, and has traded between 3,063 and 3,687 since early July. Sales of younger, modern vessels often see strong activity in Asia, helped by robust demand and a concentration of major shipyards in the region.
Europe
The European freight market is heavily influenced by energy imports (gas, crude oil) and inter-European trade. In the week to 5 November 2026, spot rates per 40ft container were $3,615 from Shanghai to Rotterdam and $4,166 from Shanghai to Genoa. Port hubs such as Rotterdam and Antwerp are major transshipment centers, and disruption there can affect rates across the continent. Vessel values in Europe are often tied to demand for specialized, lower-emission tonnage that meets regional rules such as the EU Emissions Trading System (ETS).
The Americas
Freight in the Americas is dominated by trade with Asia and South America. The Baltic Dry Index is a key reading for bulk freight activity in the region, whose rates are heavily influenced by grain and commodity exports from Brazil and the US Gulf. On 9 November 2026 the capesize index was 4,459, the panamax index 2,037 and the supramax index 1,810. Sales and prices for older tonnage are frequently set by buyers from South American or Caribbean nations with regional trading needs.
These differences mean trade lanes and market segments need to be analyzed individually.
Emerging trends: technology, sustainability and market evolution
The relationship between freight and vessel markets is being profoundly reshaped by new trends.
Technology: Digital freight platforms give stakeholders real-time data on rates and vessel availability, which speeds up chartering. Blockchain is being tested for asset transfer and for smart contracts that automate parts of vessel sales. Both uses are at an early stage.
Sustainability: Decarbonization pressure is splitting asset prices. Vessels with alternative-fuel propulsion (LNG, methanol) or with retrofitted scrubber systems tend to command a premium in both the freight and S&P markets because of lower operating costs and better compliance. This is a driver of fleet renewal.
Market Evolution: Asset tokenization divides ownership of an asset into digital fractions. Some platforms apply the model to ships, with the aim of widening the group of participants and adding secondary market trading. The model is new, and its legal and regulatory treatment differs by jurisdiction. Our tokenization guide gives background.
Practical considerations for shipowners, investors and charterers
The two markets depend on each other, and each group uses the data differently.
Shipowners: Use freight market data to compare spot and period chartering against operating costs. Use S&P data to benchmark fleet values and age profiles when planning fleet renewal.
Investors and analysts: Follow freight indices and secondhand price indices together to see how earnings and values relate. The relationship differs by segment, and the lag differs between cycles (see the section on how the freight market affects vessel values). Index data records current and past conditions and carries no forecast.
Charterers: Use vessel value data to assess the fleet health of carrier partners and to benchmark the cost of long-term contracts.
Future Outlook & Strategic Recommendations
Maritime finance is moving toward wider use of real-time data and digital tools. Platforms that connect freight data with vessel valuations are in broader use, while blockchain-based sale and purchase processes and tokenized ownership models are at an early stage. Emissions regulation and geopolitical risk will keep shaping both markets, as the Red Sea and Hormuz episodes of 2024 to 2026 show.
For market participants, a sensible first step is to track freight indices, secondhand price indices and insurance costs together, and to document the sources and dates behind every figure used in a valuation or chartering decision.
Conclusion
The freight and vessel value markets are linked, and freight rates generally lead. This guide covered how rates are set, what drives ship prices, how appraisers calculate value, and how the pandemic, the Red Sea crisis and the Hormuz conflict moved both markets between 2020 and 2026.
Both markets can swing sharply. Container ship prices rose 168% in 2021, and the BDI fell about 60% between January and May 2020. Reading the two markets together gives the clearest picture of risk in global shipping.
FAQs
What is the main difference between the freight market and vessel value?
The freight market is where the price for transporting goods is set (shipping rates). Vessel value is the price of the ship itself, which is heavily influenced by the earnings potential from the freight market.
How do freight rates affect the value of a ship?
When freight rates are high, a ship's earning potential rises, which makes the vessel more valuable to buyers and tends to push up its price in the Sale & Purchase (S&P) market.
What is the Sale & Purchase (S&P) market in shipping?
The S&P market is where commercial vessels are bought and sold. It is highly cyclical, with prices moving with macroeconomic conditions, freight rates and vessel supply and demand.
What factors besides freight rates influence a ship's value?
A ship's value also depends on its age and condition, technical specifications (such as fuel efficiency), regulatory compliance (such as emissions) and broader economic and geopolitical factors.
What is the importance of benchmarking in the maritime market?
Benchmarking uses data on comparable vessels and freight rates to assess a ship's performance and market trends. It gives buyers, sellers and charterers a common basis for comparison.
References
Splash247, 'Boxship charter market smashing records across the board' (Clarksons data), April 2021. https://splash247.com/boxship-charter-market-smashing-records-across-the-board/
Sourcing Journal, 'Container Shipping's Red Sea Comeback is Outpacing the Risk Warnings', October 2026. https://wwd.com/sourcing-journal/logistics/red-sea-return-suez-canal-container-shipping-comeback-risk-houthis-1239347017/
FreightWaves, '2021's top shipping stories: From Ever Given to epic California port pileup', December 2021. https://www.freightwaves.com/news/2021s-top-shipping-stories-from-ever-given-to-epic-california-port-pileup
Baird Maritime, 'Baltic dry bulk index heads higher on Capesize and Panamax rally', 9 November 2026. https://www.bairdmaritime.com/shipping/dry-cargo/bulkers/baltic-dry-bulk-index-heads-higher-on-capesize-and-panamax-rally
Daily Cargo News, 'Baltic Exchange Weekly Report - 6 November 2026', 9 November 2026. https://www.thedcn.com.au/news/baltic-exchange-weekly-report-6-november-2026
Seatrade Maritime, 'Drewry container index slips below $2,000 per feu' (Drewry World Container Index data). https://www.seatrade-maritime.com/containers/drewry-container-index-slips-below-2-000-per-feu
Hellenic Shipping News, 'Drewry: World Container Index down by 0.2%, but still 291.8% higher than year before', assessment of 30 September 2021. https://www.hellenicshippingnews.com/?p=889555
Transport Journal, 'Clarksons: A special year for second-hand ships' (Clarksons index data for 2021). https://m.transportjournal.com/artikeldetail/clarksons-a-special-year-for-second-hand-ships.html?L=n.html
gCaptain / Bloomberg, 'Hot market quadruples prices for used containerships', 3 March 2021. https://gcaptain.com/hot-market-quadruples-prices-for-used-containerships
Government of Nova Scotia, Department of Finance, 'Baltic Dry Index, December 2021', 31 December 2021. https://novascotia.ca/finance/statistics/news.asp?id=17418
Logistics Material, 'Red Sea Shipping Crisis 2026: Suez Return, Hormuz Risk and What to Do' (cites Marsh, July 2026, and Fairway ETA, May 2026). https://logisticsmaterial.com/trade/red-sea-shipping-crisis/
Global Strategy Files, 'The War Premium on Trade: What Hormuz, the Red Sea and the Black Sea Add to Freight, Insurance and Prices', retrieved 24 October 2026. https://globalstrategyfiles.com/war-premium-shipping-costs-freight-insurance-hormuz-red-sea-inflation-2026/
Poland Insight (Drewry data), 'Shanghai-Rotterdam Freight Rate Falls to $3,615 as Suez Capacity Returns', 9 November 2026. https://polandinsight.com/shanghai-rotterdam-freight-rate-suez-34522
KuCoin News (Shanghai Shipping Exchange data), SCFI of 6 November 2026. https://www.kucoin.com/news/flash/china-approves-hydroxide-lithium-and-sunflower-oil-futures-trump-comments-on-iran-war-possibility
Global Maritime Hub (Alphaliner data), 'Transpacific spot rates make China-US West Coast the most lucrative major trade', 9 November 2026. https://globalmaritimehub.com/transpacific-spot-rates-make-china-us-west-coast-the-most-lucrative-major-trade/
Regulatory disclosure: Shipfinex FZCO holds VARA In-Principle Approval (IPA/26/01/002) for Virtual Asset Broker-Dealer Activity. This is an In-Principle Approval, not a full operational licence. Shipfinex is not authorised to commence operations or conduct virtual asset activities until it obtains final authorisation from the Virtual Assets Regulatory Authority (VARA). This article is for informational purposes only and does not constitute legal advice, regulatory guidance, or an offer or invitation to deal in virtual assets or securities. All investments carry significant risk, including the potential for total loss. This is a high-risk asset. See the full Risk Disclosure Statement.

Capt. Vikas Pandey
Founder & CEO of Shipfinex
Capt. Vikas Pandey is Founder and CEO of Shipfinex, a platform holding VARA In-Principle Approval (IPA/26/01/002) for tokenized maritime asset participation. A mariner turned seasoned entrepreneur, he combines direct vessel operational experience with maritime finance expertise to develop a platform intended to provide economic exposure to vessel-owning SPVs.


